

PHM 2026 Data Challenge: Estimating Gear Damage from Inexpensive Sensors
Industry Operations Note special edition: gear damage estimation data challenge
The PHM Society's 2026 North America data challenge asks teams to estimate gear tooth damage from inexpensive sensor data. Tooth images are provided only for the training experiments, while the evaluation experiments come with vibration, encoder, and operating-condition data alone. The competition closed on August 7.
This article was written against the PHM Society's PHM North America 2026 Data Challenge description page (as modified on August 12) and the close-of-competition standings page, as of August 15, 2026.
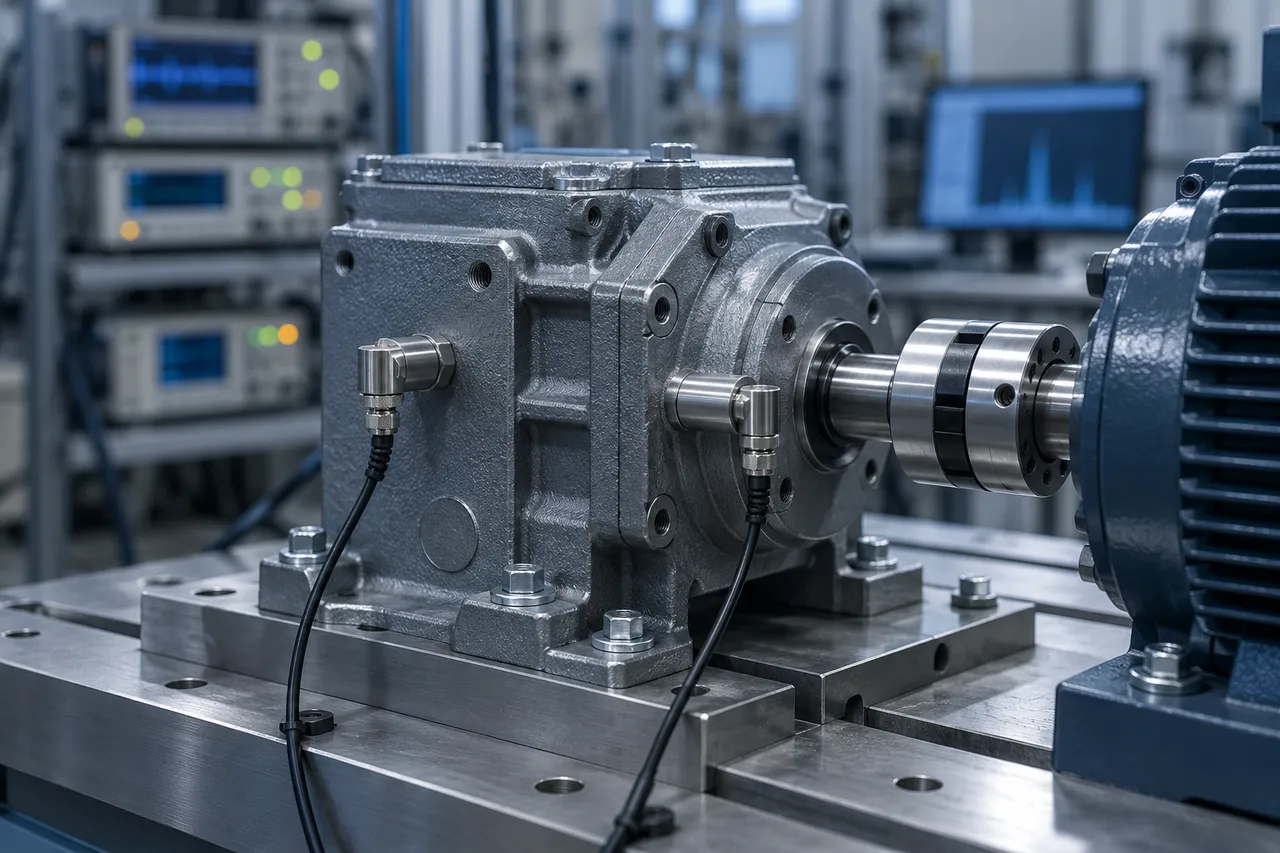
Staged image of a gear accelerated life test rig. It is not the actual PHM 2026 challenge equipment and does not show any specific product or site.
Estimating gear damage from inexpensive sensors
The challenge description page went up on April 28, and the PHM Society announced the launch on May 4 (PHM Society launch announcement). The task is defined as estimating gear tooth damage states using inexpensive sensor measurements, with periodic imaging data available only during training (challenge description page).
The organizers start from the spread in damage progression. Wear-driven surface cracking and fatigue crack growth vary widely from one specimen to the next, which shows up as large scatter in reliability analysis. Models used for remaining useful life (RUL) prediction, condition-based monitoring (CBM), and PHM decisions need to account for that variation.
How tooth damage progresses, and why imaging is limited
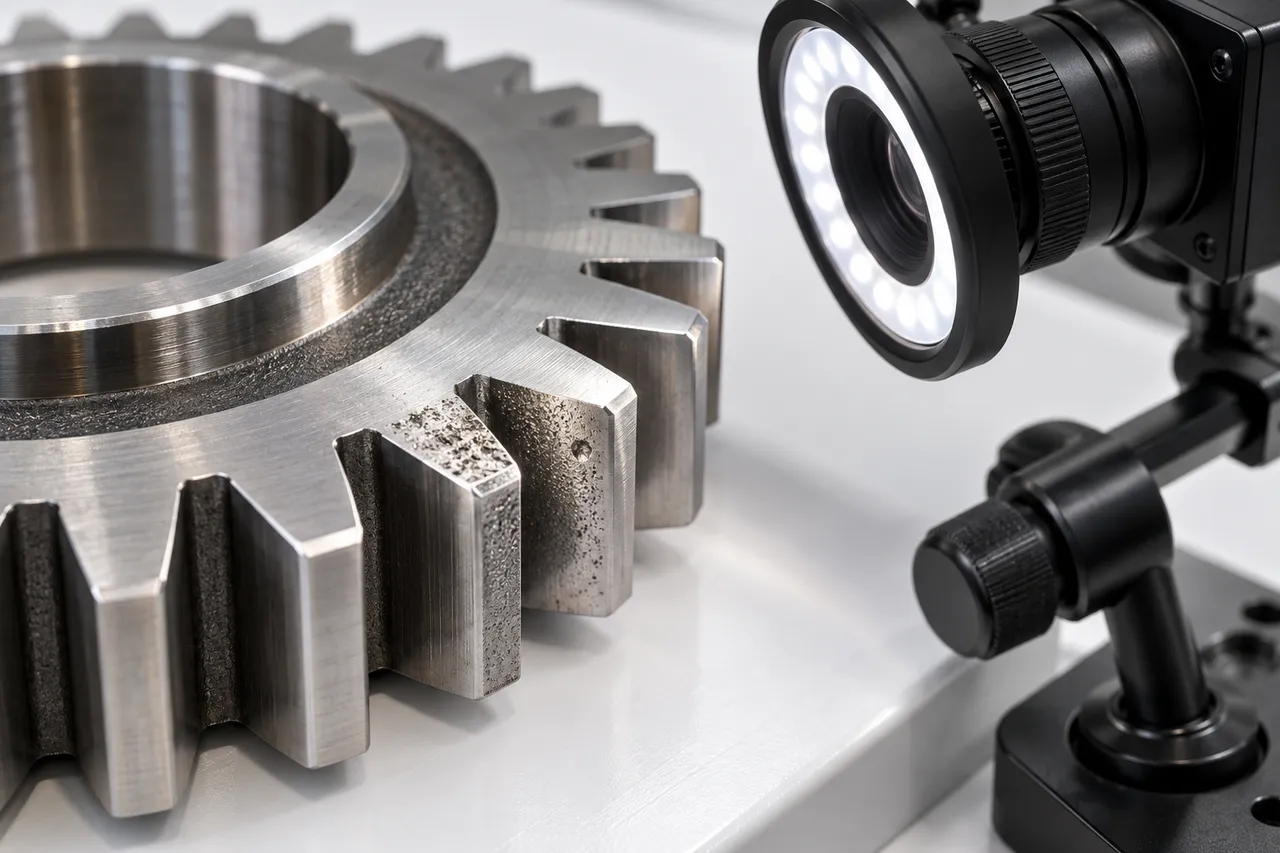
Staged image of gear tooth surfaces being photographed. It is not an actual image from the challenge data and is not tied to any specific product or site.
The damage in question is spalling on the gear tooth flank. According to the task description, damage progresses from wear to micropitting to pitting to spall formation, and it starts and grows independently on each tooth. With damage on each of the 28 teeth progressing separately, representing the whole gear with a single number first requires a choice of how to aggregate.
Periodic imaging is the most reliable direct assessment of tooth damage. The task description also calls it "costly and operationally disruptive." Because tooth surfaces cannot be photographed continuously without stopping the machine, the challenge asks for damage estimates from inexpensive sensors that can collect data during operation.
The accelerated life experiments and the data provided
The challenge provides seven accelerated life experiments, A through G. The setup is a simple gearbox with a one-to-one gear ratio, and in each experiment a 28-tooth spur gear runs until failure. Failure is defined as the point where the gear becomes unusable, and lifetimes range from about 30 to 90 hours. Most individual runs last about 6 hours.
Vibration is measured with two accelerometers, one axial and one radial, and the task description notes that the radial accelerometer is more sensitive. Vibration and encoder signals are sampled at 102.4 kHz, and operating conditions such as torque, speed, and temperature are logged at 1 Hz. Inline oil sensor data is included, but the task description says it can be ignored. The data comes as one-minute HDF5 files converted from the original LabVIEW TDMS files.
The organizers also supply classical vibration condition indicators, FM4, NA4, M6a, and ALR, computed over non-overlapping 1-second segments. Time synchronous average (TSA), residual, and difference signals are included as well. Teams can use these indicators directly or extract new features from the raw signals.
Data split and the two subproblems
The seven experiments are split into three for training, two for testing, and two for validation. Training experiments include the full sensor data plus images of all 28 teeth at roughly 6-hour intervals. Test and validation experiments include sensor data only. None of the sets ships with organizer-defined ground truth damage values.
The first subproblem is defining a damage scale. Teams estimate spall size or severity per tooth from the training images, then aggregate it into a single scalar damage value, for example by maximum, mean, or weighted sum, to build their own damage trajectory for each training experiment.
The second subproblem is training a model that estimates that scalar damage value at 6-hour intervals from sensor data. Teams use the model to estimate damage trajectories for the test and validation experiments and submit them. During the test phase, score feedback was available every 24 hours.
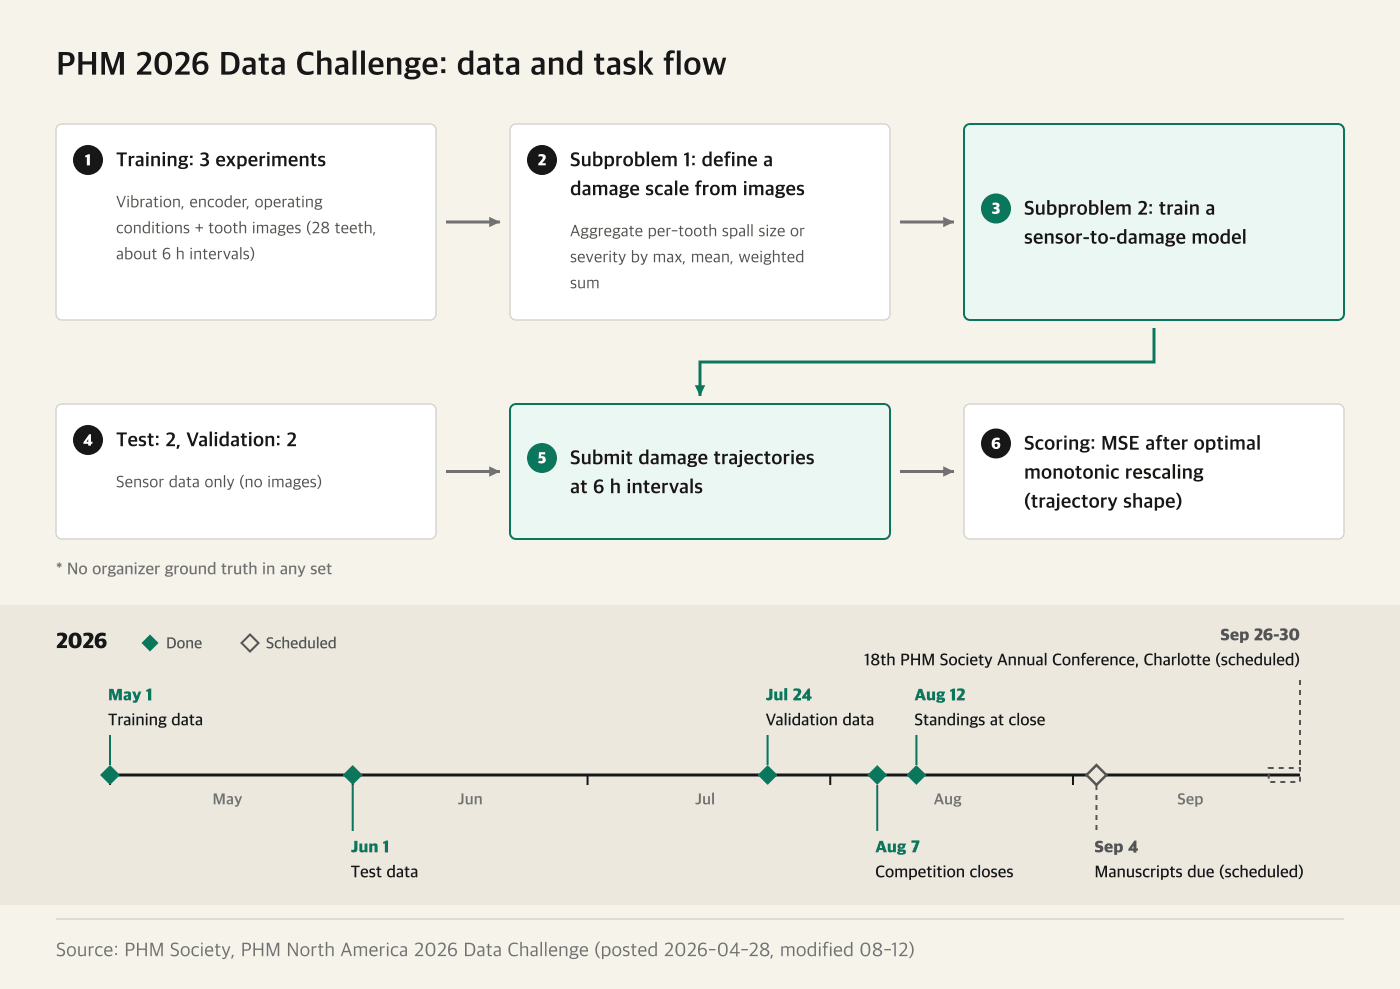
Figure 1. PHM 2026 Data Challenge data split, subproblems, scoring, and schedule. Dashed items were still scheduled as of August 15. Source: PHM Society, PHM North America 2026 Data Challenge (posted April 28, 2026; modified August 12).
Scoring: mean squared error after a monotonic transformation
Staged image of damage estimates being reviewed in a lab. The waveforms and curves on screen are decorative and are not challenge data or results.
Submissions are scored by mean squared error (MSE) against ground truth trajectories that the organizers compute with a fixed, undisclosed method. Because every team defines its own damage scale, the task description says submitted trajectories may be rescaled with an optimal monotonic transformation before evaluation. According to the description, this focuses the evaluation on trajectory shape rather than absolute scale.
A monotonic transformation preserves the ordering of values, so once it is applied, the units and range a team chooses do not affect its score. What matters is how accurately the estimate captures where damage progressed slowly and where it accelerated.
The task description states that elapsed time should not be used as a proxy for damage, because lifetimes vary so much between experiments. Sensor measurements should be read as indicators of damage severity, not of elapsed time. Test and validation experiments may run well beyond the range seen in training, so a model that leans on operating time can drift on the evaluation experiments.
Standings at close and the conference schedule
The challenge opened with a soft launch of the training data on May 1. Test data followed on June 1 and validation data on July 24, and the competition closed on August 7. On August 12 the PHM Society published the Standings at Close of Competition (final scores page).
Thirty-some teams appear in the standings, and close to 20 submitted final validation results. The top validation score at close was 2.2. That is the competition's scoring scale, where 0 is perfect, not a field damage detection rate.
Final awards have not been decided. The organizers also judge creativity and presentation, and the top three teams receive prize money. Five teams were invited to give oral presentations and five to present posters. Award eligibility requires writing and presenting a paper, with manuscripts due September 4.
The 18th Annual Conference of the PHM Society is scheduled for September 26-30 in Charlotte, North Carolina, with the challenge session tentatively set for September 28 (PHM 2026 conference). The PHM Society is a nonprofit working to develop PHM as an engineering discipline, and the conference draws participants from energy, aerospace, transportation, automotive, smart manufacturing, industrial data science, and AI.
The PHM Europe 2026 challenge takes a different target: estimating remaining useful life from door position degradation on the PIMSSIS test bench, a three-phase brushless servomotor used in subway gate doors (PHM Europe 2026 challenge).
What it means for field condition monitoring
The challenge turns the labeling problem of predictive maintenance directly into a task. The most accurate way to confirm actual damage is to stop the machine and photograph or disassemble it, which is expensive and disrupts operation. In the field, data with confirmed damage levels usually appears only occasionally, at maintenance or teardown inspections.
Asking teams to define their own damage scale mirrors field conditions too. A plant has to decide first whether maintenance decisions follow the worst tooth, the average across teeth, or a weighted sum. That decision ties into the maintenance decision criteria covered in Note 2 of 6, Condition-Based Maintenance: Define the Decision Before Choosing Sensors.
Even with identical experiment setups, lifetimes spread from about 30 to 90 hours. That spread is why the task description rules out elapsed time as a damage proxy. Judging damage from operating hours or maintenance intervals alone runs into the same limit.
The organizers provided the classical condition indicators, the TSA, residual, and difference signals, and the raw signals. That lets teams compare indicator-based and raw-signal approaches. In the field, storing only condition indicators rules out applying other analyses later, so the retention scope for raw signals needs to be decided alongside them.
Field checklist
- List the moments when damage can be confirmed directly (maintenance, teardown inspection, imaging), and record sensor data alongside each one.
- Decide how part-level damage rolls up into an equipment-level value (maximum, mean, weighted sum) based on your maintenance decision criteria.
- Check that elapsed time or operating hours are not standing in for a damage indicator.
- Record sensor mounting positions and directions. In the challenge data, the axial and radial accelerometers differed in sensitivity.
- Log operating conditions such as torque, speed, and temperature on the same time base as the vibration data.
- Decide how much raw signal to retain alongside condition indicators.
- Build into the validation plan the possibility that new equipment or new operating conditions run beyond the lifetimes seen in training data.
- Do not read public challenge scores as field detection rates; validate again on data from your own equipment.
Summary
The PHM 2026 Data Challenge poses, as an open task, the problem of using expensive image labels only for training and estimating gear damage trajectories from inexpensive sensors at evaluation time. The challenge presentations are scheduled for the September 26-30 conference, and final awards follow review of the papers and presentations, so methods are best interpreted once the papers are presented. Task rules and data details are on the challenge description page, and the standings are on the final scores page.
A monitoring rollout likewise needs to settle when labels will be collected and what the damage scale is before the collected signals can feed maintenance decisions. Tools that continuously monitor equipment with sound, vibration, and environmental signals should be evaluated against the same criteria, and XyloZero is one such tool.
Note 3 of 6, Acoustic and Vibration Monitoring: Choosing the Right Signal, covers vibration sensor selection, and Note 6 of 6, Industrial Monitoring Pilots: How to Move From PoC to Operations, covers field validation design.
Official sources
- PHM Society, PHM North America 2026 Conference Data Challenge description
- PHM Society, 2026 PHM North America Conference Data Challenge launch announcement
- PHM Society, PHM 2026 Conference Data Challenge final scores
- 18th Annual Conference of the PHM Society (PHM 2026)
- PHM Society, PHM Europe 2026 Conference Data Challenge